
The Real Cost of Bad Product Images on a Canadian E-commerce Store (And the Maths to Fix It)

Picture this: your paid traffic numbers look healthy, your pricing is competitive, and your product descriptions are thorough. Yet your conversion rate sits stubbornly below industry benchmarks, and you cannot pinpoint why. For many Canadian e-commerce store owners, the answer is hiding in plain sight on the product page itself.
Weak product visuals are not a design problem. They are a revenue problem, and the mathematics behind that distinction are more consequential than most sellers realise. With cart abandonment averaging 70.22% across e-commerce benchmarks and product pages accounting for roughly half of all session activity, every percentage point of conversion improvement translates into compounding revenue gains. The good news is that closing that gap does not require a large production budget. Tools like a free mockup generator have made professional-quality visuals accessible to independent sellers at minimal cost, which changes the ROI calculation significantly.
This analysis builds a concrete financial model to quantify what poor imagery is costing your store, walks through where in the conversion funnel the damage occurs, and provides a practical visual audit framework you can apply immediately. The goal is not to persuade you that visuals matter; it is to show you the exact numbers that prove it.
Why Product Images Are a Revenue Variable, Not Just a Design Choice
Most Canadian store owners set up their product images once and move on. Those visuals then sit untouched for months or years, quietly underperforming while the rest of the store gets optimised. That is not a design oversight; it is a revenue leak.
The market context makes this more urgent than it has ever been. E-commerce now represents 17.1% of total U.S. retail sales in Q2 2026, with year-on-year growth returning to double digits for the first time in five years. North American competitive pressure on product presentation is compounding alongside that growth, and Canadian sellers are operating inside the same dynamic.
Within that competitive environment, the product image occupies a disproportionately powerful position in the funnel. Approximately 50% of all store sessions reach the product page, per Smart Insights micro-conversion benchmarks, making the product image the single most-viewed sales asset a store owns. Nothing else in the funnel gets that exposure.
The traffic composition makes image quality even more consequential. Google PPC drives 62.50% of measured e-commerce sales, with 10.84% growth as of August 2026. The majority of shoppers landing on a product page are cold traffic; they have no prior relationship with the brand. The image is the entire first impression.
Understanding how AI mockup generators turn design files into professional product visuals in seconds reframes the economics here. Image quality is not a fixed production cost. It is a conversion variable, and when every paid traffic dollar depends on that variable, improving it is a multiplier on media spend, not a line item in the design budget.
The Conversion Funnel: Where Bad Images Do Their Damage
With half of all sessions reaching the product page, conversion quality at that stage determines everything downstream.
Baymard Institute benchmarks average cart abandonment at 70.22%, but published studies across store types range from 55% to 84.27%. That gap represents the performance difference between optimised and unoptimised stores, and much of it is recoverable.
Cart abandonment is a downstream symptom. The upstream problem occurs earlier, at the product page itself, where a visitor decides whether the item is worth adding to cart at all. A weak image doesn't just fail to close a sale; it eliminates purchase intent before the cart is ever involved.
This is particularly consequential for a print on demand business. When customers cannot physically handle a garment, the product mockup is the only tangible evidence of quality they have. It carries the entire burden of communicating fabric feel, fit, and finish visually. A flat, poorly rendered mockup signals low quality even when the underlying product is excellent. If you've seen how weak product visuals quietly erode sales across marketplaces like Etsy and Amazon, the same mechanism operates on your own store, just without the platform's baseline traffic to cushion the damage.
Poor imagery fails at two funnel stages simultaneously: the product page view, where the image must create enough confidence to prompt action, and the add-to-cart decision, where that confidence either holds or collapses.
The multi-channel dimension sharpens the stakes further. Affiliate channel sales grew by +152.11% in August 2026, meaning visual assets are now redistributed across partner sites, comparison pages, and curated listings at scale. One low-quality mockup no longer damages a single product page; it degrades credibility across every platform carrying that asset at once.
Building the Maths Model: Revenue Lost Per Conversion Point
Knowing where conversions break down is only useful if you can price the damage. Here is a simple model that makes the number concrete.
Baseline assumptions: a Canadian store with 5,000 monthly sessions, a 2% conversion rate, and a CAD $60 average order value (AOV). That produces 100 orders and CAD $15,000 in monthly revenue.
A one-percentage-point lift to 3% produces 150 orders from identical traffic. Transaction volume rises 50% with zero additional spend on acquisition. At CAD $60 AOV, the gain is CAD $3,000 per month, or CAD $36,000 per year, generated entirely from the traffic already being paid for.
The model sharpens further when traffic cost is included. If the store allocates CAD $1,500 per month to Google PPC, a reasonable figure given that PPC accounts for 62.50% of measured e-commerce sales, the current cost per acquisition sits at CAD $15. After the conversion lift, that figure drops to CAD $10, a 33% reduction in acquisition cost with no change to the media budget.
A note on transparency: these figures use stated assumptions, not a controlled study specific to Canadian apparel stores. The 2% baseline and CAD $60 AOV are illustrative mid-market inputs. Substitute your own session volume, conversion rate, and AOV to produce a store-specific result. Even a 0.5% lift on a smaller store, say 2,000 monthly sessions at CAD $50 AOV, adds CAD $6,000 annually from the same traffic. The arithmetic scales; the logic does not change.
What Does a Visual Upgrade Actually Cost?
So the CAD $36,000 annual upside from the model has a natural counterpart question: what does it actually cost to get there?
Traditional product photography for an apparel line carries real overhead. Studio hire, a photographer's day rate, model fees, and post-production editing combine quickly, with a modest shoot covering a handful of SKUs routinely running substantial per-shoot overhead. For a print on demand business launching new t-shirt, hoodie, and sweatshirt designs regularly, that cost structure makes no sense. Re-shooting every new design is economically impractical, which creates a structural case for mockup-based visuals as the scalable alternative.
A free mockup generator changes the cost model entirely. It eliminates the per-shoot expense for initial testing, letting store owners validate how a design looks on a garment before committing to paid promotion or production runs. Generating professional mockups in one click removes the camera, the studio booking, and the editing queue from the workflow.
Mocksy lets you generate professional garment mockups in one click, t-shirts, sweatshirts, hoodies, and tank tops, with a free entry point that requires no upfront commitment. It is a zero-risk way to assess visual quality lift before spending anything.
When placed against the CAD $36,000 annual revenue figure from the worked example, even a mid-tier subscription looks negligible. The payback period is measured in days of incremental revenue, not months.
The Compounding Effect: Why the Gains Multiply Across Channels and Campaigns
The ROI case above rests on a single product page. The real leverage comes from what happens next.
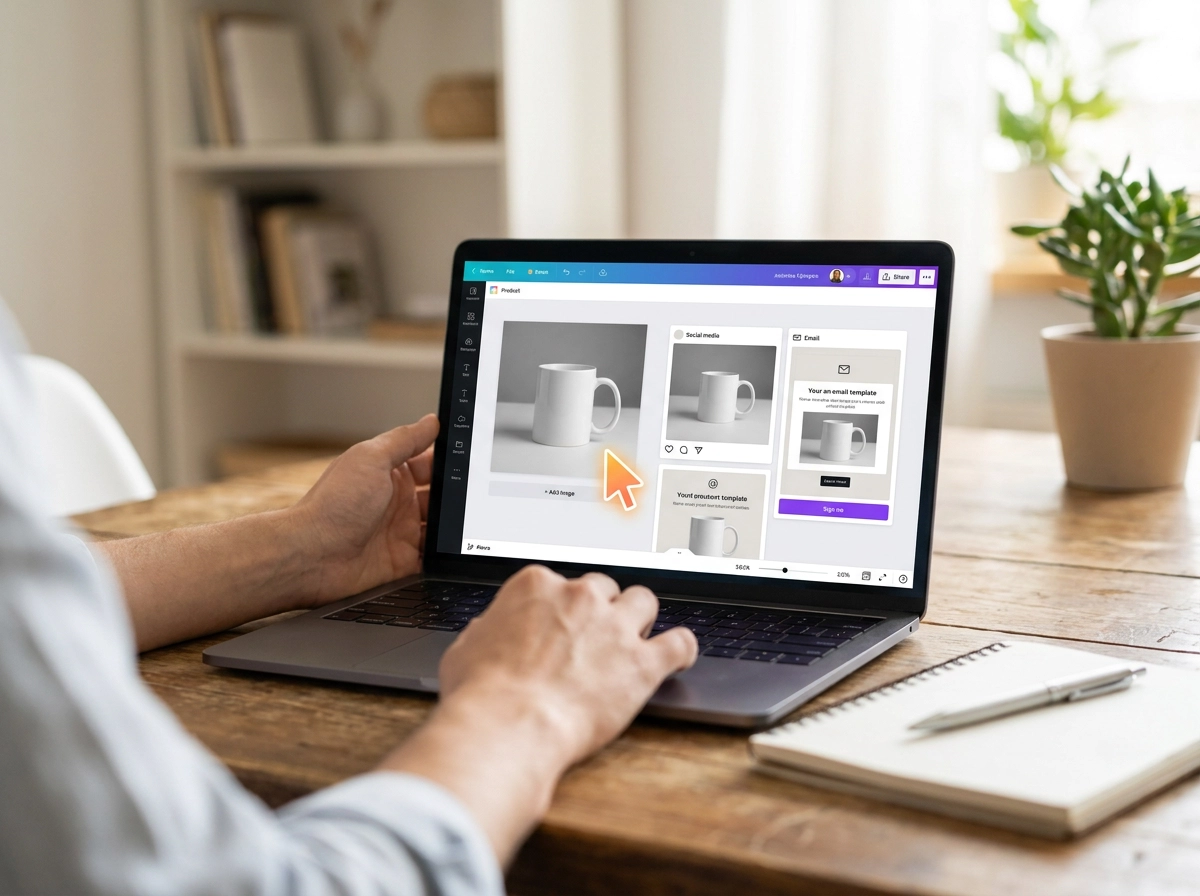
One professional mockup asset does not retire after the product listing goes live. The same image fuels ad mockups across paid social and Google Shopping, anchors the hero visual in email campaigns, and gets picked up by affiliate partners distributing your products across their own channels. One visual investment, deployed simultaneously across every touchpoint.
That multi-channel reach amplifies both outcomes. As established, affiliate channels grew by +152.11% in August 2026 -- a strong mockup propagates the advantage across that expanding network, while a weak one propagates the credibility problem at the same accelerating rate.
Email presents a sharper version of the same logic. The channel currently accounts for 8.63% of e-commerce sales but is declining at -15.14%, which means every campaign email sent needs to earn its open. A compelling hero product image is not decorative in that context; it is doing structural conversion work in a shrinking-attention environment.
Consistent ad mockups reinforce brand recognition across every impression, reducing the cognitive friction that quietly feeds cart abandonment before a shopper even reaches checkout.
The compounding argument is precise: a 1% conversion lift on the product page, applied consistently because the same asset runs across PPC, organic, affiliate, and email traffic together, means every channel captures the gain from one visual decision. The investment does not divide across channels; the benefit multiplies across all of them.
The Canadian Context: Why Local Sellers Face Sharper Stakes
Those compounding multi-channel gains matter everywhere, but Canadian sellers face structural pressures that make visual quality an even sharper commercial priority at home.
Canada's e-commerce market reached $59.2 billion CAD in 2025, representing just 0.67% of an $8.86 trillion CAD global market growing at roughly 7% annually. Canadian store owners compete directly with international sellers, many operating in markets with larger visual production budgets and faster growth curves. The playing field is global by default.
In apparel and print-on-demand categories specifically, that competition is acutely visual. Canadian shoppers apply the same quality expectations to an independent Shopify store as to an established retail brand. A flat, low-resolution garment image signals amateur production regardless of how good the actual product is.
Most Canadian print-on-demand businesses launch lean. As noted, per-shoot costs make reshooting every new design impractical, and a free mockup generator removes that cost barrier entirely, letting sellers produce credible visuals before committing a single dollar to promotion or inventory.
The scalability benefit compounds this further. One of the core benefits of an online store is the ability to list new designs rapidly without logistical constraints. That advantage disappears when visual production becomes the bottleneck. A tool that generates professional mockups in one click keeps the design pipeline moving without sacrificing presentation quality.
Finally, mobile commerce adoption continues to climb across Canada. On a small screen, low-contrast imagery and flat lighting degrade faster than on desktop, directly reducing purchase confidence at the moment of decision.
From the Model to Action: A Practical Visual Audit Framework
Knowing the stakes makes the audit worth doing. Here is how to run it against your own store data.
Step 1: Pull your real numbers. Open your analytics dashboard and record three figures: monthly session volume, current conversion rate, and average order value. Plug them into the maths model from Section 3 rather than using the worked example. Your store's specific revenue-per-conversion-point is the only figure worth acting on.
Step 2: Audit your lowest-converting product pages through cold eyes. Imagine a shopper arriving from a Google PPC ad, seeing your brand for the first time. Do the current images give that visitor enough confidence to add to cart? If the answer is uncertain, the image is underperforming.
Step 3: Prioritise your top five revenue-generating SKUs first. A one-percentage-point conversion lift on a high-volume product produces a larger absolute revenue gain than the same lift on a low-traffic listing. Fix where the money already flows before expanding to the full catalogue.
Step 4: Generate professional mockups before committing to a rollout. Mocksy lets you produce garment mockups for t-shirts, hoodies, sweatshirts, and tank tops in one click, with a free entry point that requires no upfront commitment. Test the new visual against the existing image before making it live across the store.
Step 5: Deploy upgraded visuals across every channel at once. Publish the same assets to your ad mockups, affiliate listings, and email campaigns simultaneously. The multi-channel compounding benefit only activates when every traffic source serves the improved image, not just the product page where the audit began.

The Maths Makes the Case: What to Do Next
Once the audit is complete and the numbers are in front of you, the argument tends to close itself.
As the model showed, a one-point lift on a $15k/month store is worth $36k/year -- and as covered earlier, the cost of achieving that lift through better product visuals is a fraction of one month of that incremental gain. That ratio is not a close call.
Run the model with your own figures. Substitute your actual session volume, conversion rate, and average order value, and the exercise typically reframes a visual upgrade from a discretionary project into an immediate commercial priority.
If you sell garments including t-shirts, sweatshirts, hoodies, or tank tops, Mocksy lets you generate professional garment mockups in one click with a free entry point that requires no upfront commitment, making it a genuinely zero-risk starting point for testing whether stronger visuals move your numbers.
The forward-looking reality is straightforward. Canadian e-commerce reached $59.2 billion CAD in 2025 and competition from both domestic and international sellers is intensifying across every channel simultaneously. In that environment, the cost of inaction is not neutral. Every month a product page carries weaker visuals than the competition is a month of conversion potential left on the table. The maths that justifies the upgrade today compounds against you tomorrow if it stays unread.
Conclusion

The evidence is clear: product images are a revenue variable with measurable, modelable consequences. Weak visuals bleed conversion at every funnel stage, and in Canada's increasingly competitive e-commerce landscape, that bleed compounds monthly. The maths consistently shows that a modest conversion lift outpaces any realistic visual investment by a wide margin. And the tools to close that gap are more accessible than most sellers assume.
The action is straightforward. Run the model with your own numbers, identify your weakest product pages, and treat a visual upgrade as the commercial decision it actually is, not a design preference.